Results

Interactive diagram
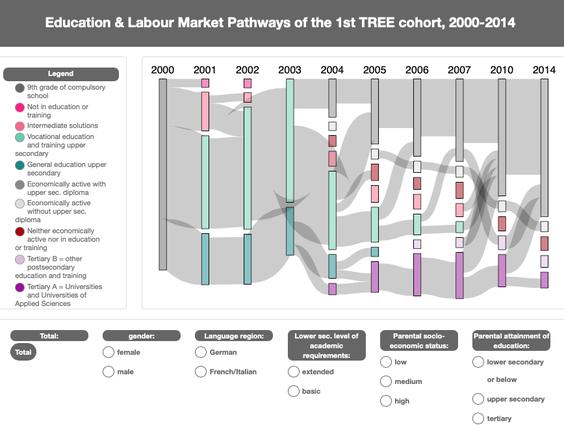
Explore our interactive diagram of the 1st TREE cohort’s educational and labour market pathways! The diagram covers the years 2000 to 2014, from the end of compulsory school up to average age 30.
It can be filtered by gender, linguistic region, lower secondary track attended, socio-economic status and parental educational attainment.